
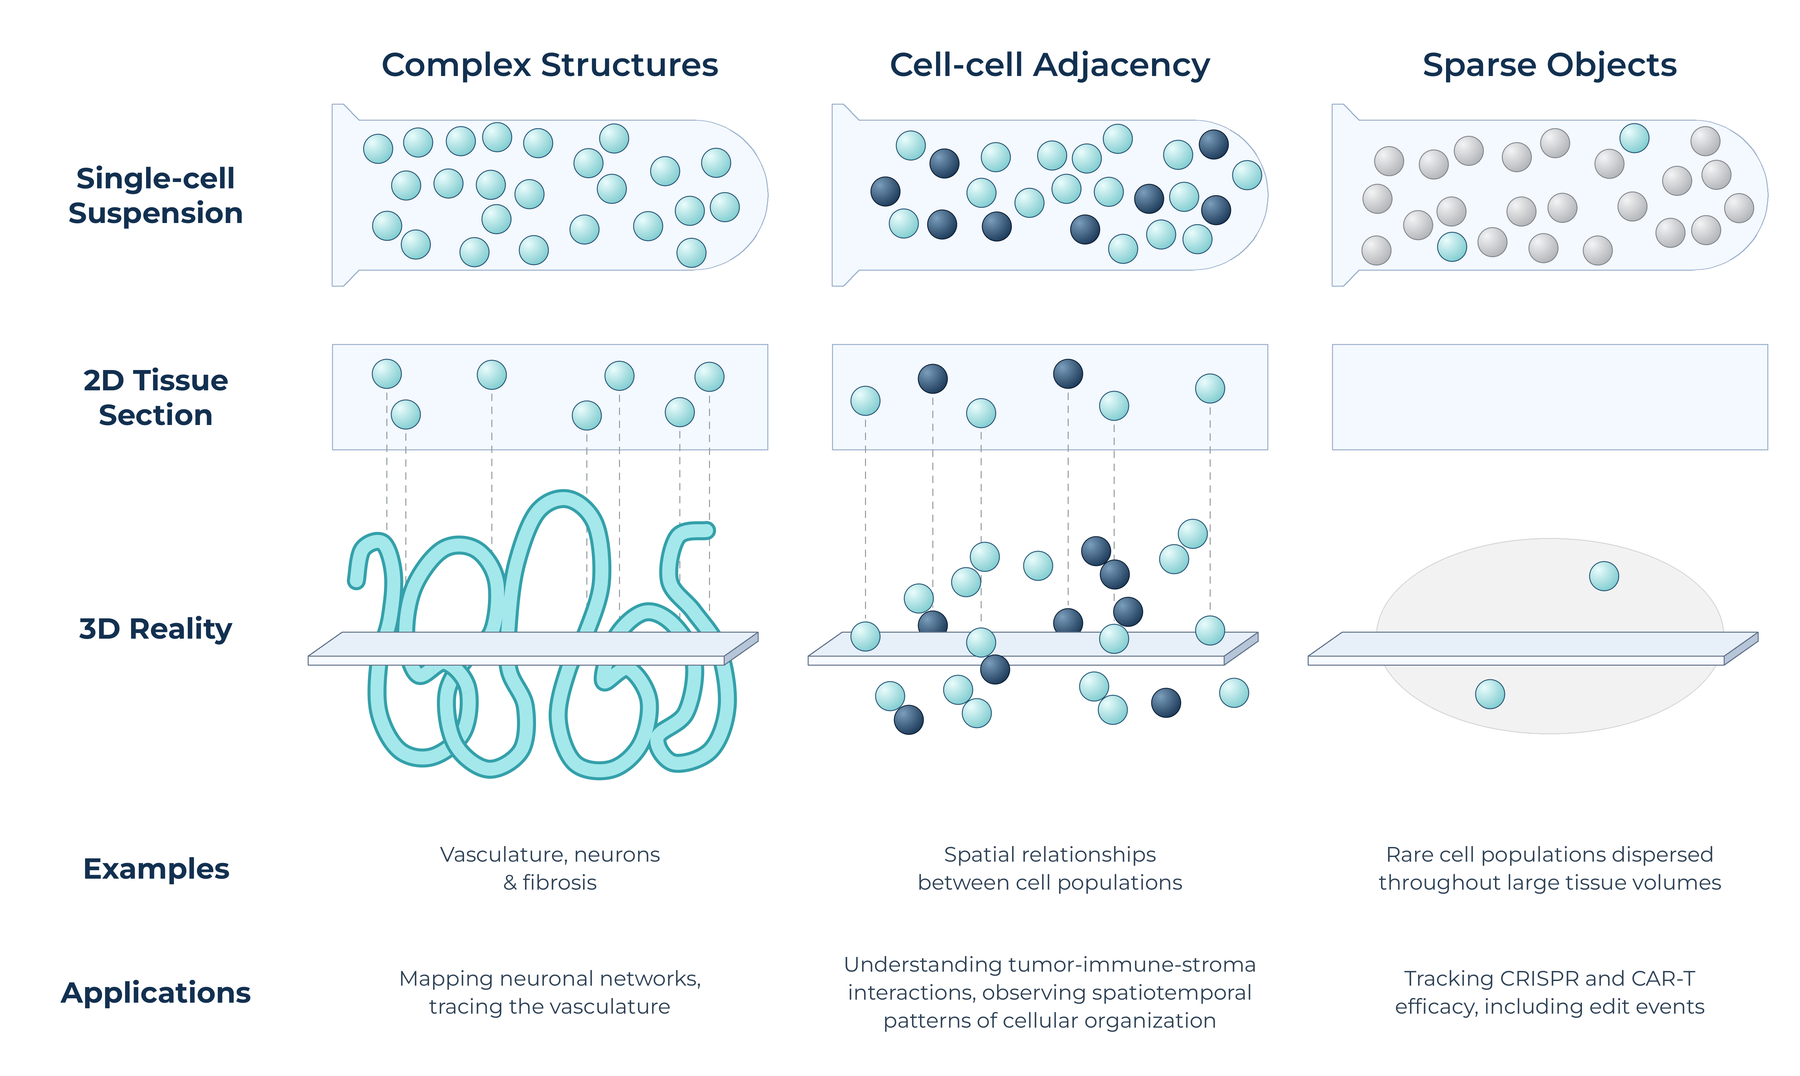
Cellular atlases built from single-cell RNA sequencing have transformed biology — but dissociating cells erases the spatial relationships that drive disease.
Single-cell RNA sequencing (scRNA-seq) has done more to map cellular complexity than almost any technique of the last decade, producing comprehensive atlases of healthy and diseased tissue across organ systems. But traditional transcriptomic analysis methods share a structural limitation: reliance on dissociated single-cell samples, or thin 2D tissue sections, inevitably strips away the crucial spatial context of how layers of diverse cells interact in three dimensions.
The Trade-Off Built Into Every Dissociation-Based Experiment
Getting single-cell resolution from scRNA-seq requires dissociating intact tissue into a suspension of individual cells before sequencing. It’s an effective way to isolate and profile cells, but cells do not exist in isolation in the body — they exist in a dense, three-dimensional structure, and dissociation strips away the cell-cell interactions that occur in that native space before a single transcript is ever read.
Understanding cellular function critically depends on preserving 3D spatial context, because cell positioning and the surrounding microenvironment profoundly influence disease progression, therapeutic response, and overall tissue function. A gene expression profile without spatial context can tell you what a cell is; it can’t tell you what that cell is doing next to, or in response to, its actual neighbors.
Working Example: Kidney Cell Typing Without Dissociation
A Stellaromics application brief demonstrates one path around this limitation directly in the kidney, an organ where scRNA-seq atlases have already linked specific cell subsets to conditions like diabetic nephropathy, acute kidney injury, and renal cell carcinoma. Using a 64-gene panel and STARmap™ in situ sequencing, key kidney cell populations were subset with single-cell precision directly within intact, 50 μm thick adult mouse kidney tissue. Spatial mapping confirmed each cell type localized to its expected anatomical region, the piece a dissociated suspension structurally cannot provide.
Working Example: Mapping Cellular Neighborhoods in the Alzheimer’s Brain
A second Stellaromics application note extends the same in situ, no-dissociation approach to neurodegenerative disease. Using a 225-gene neural cell-typing panel on APP/PS19 Alzheimer’s model mice, researchers quantified actual cell-cell adjacency networks directly within intact brain tissue. The majority of cells were found within 300 microns of an amyloid plaque, and specific cell types showed distinct neighborhood patterns: certain excitatory neuron subtypes and astrocytes were enriched near plaques, while choroid plexus cells and oligodendrocytes were enriched farther away. None of that spatial patterning survives tissue dissociation.
From Cell Types to Cell Neighborhoods
Both examples produce a familiar cell-by-gene matrix, compatible with standard single-cell tools like Scanpy and Seurat, but with XYZ spatial coordinates attached to every cell. That combination is what lets researchers move from asking which cell types are in this tissue to which cell types are near each other, and how that changes in disease — resolving cellular neighborhoods, gradients, and interactions across multiple layers, the dimension of biology that is lost the moment a tissue is dissociated.
Where This Is Headed: The Tumor Microenvironment
The same no-dissociation, cellular-neighborhood approach points naturally toward immuno-oncology. Published research already supports the value of this angle: mapping the spatial relationship between tumor-infiltrating lymphocytes (TILs) and tumor cells to confirm TIL efficacy, and detecting rare cell-to-cell communication events tied to immunotherapy drug resistance. Tumor microenvironment mapping is an area Stellaromics is actively expanding into, applying the same in situ, single-cell-resolution approach validated in kidney and brain tissue to the immune-tumor cell neighborhoods that drive treatment response and resistance.
Frequently Asked Questions
What is the difference between single-cell RNA sequencing and spatial transcriptomics?
Single-cell RNA sequencing profiles gene expression in individual cells after dissociating tissue into a suspension, losing information about spatial organization of the cells in their native tissue microenvironment. Spatial transcriptomics profiles gene expression directly within intact tissue, preserving each cell’s position and its relationships to neighboring cells.
Can this approach identify disease-relevant cell neighborhoods, not just cell types?
Yes. In an Alzheimer’s disease model, this approach quantified which brain cell types cluster near amyloid plaques and which do not, and in kidney tissue it confirmed that resolved cell types localize to their expected anatomical regions — neighborhood-level detail that dissociation-based methods cannot capture.
Is Stellaromics working on tumor microenvironment applications?
Yes. Pyxa has applications in tumor microenvironment and immuno-oncology analysis, building on published research on TIL-tumor spatial relationships and immunotherapy resistance, and on the same STARmap methodology already applied to kidney and brain tissue.