
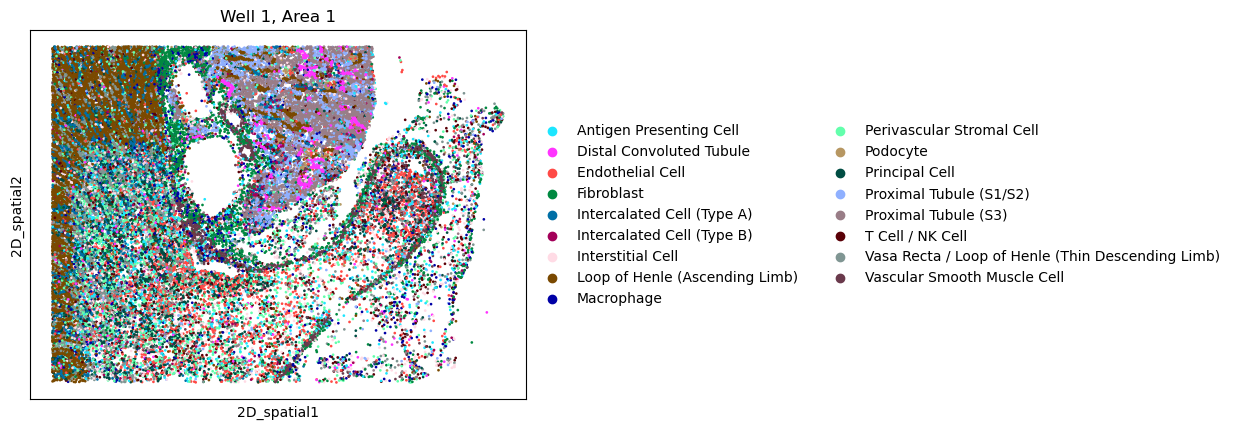
A 64-gene panel resolves the kidney’s specialized cell populations directly within intact, thick tissue — no dissociation required.
Single-cell RNA sequencing has done more to map the kidney’s cellular complexity than perhaps any technique of the last decade. By profiling the transcriptomes of thousands of individual cells, researchers have built comprehensive atlases of healthy and diseased human and mouse kidneys, and used them to compare conditions like diabetic nephropathy, acute kidney injury, and renal cell carcinoma against healthy tissue — identifying disease-associated gene signatures and dysregulated signaling pathways specific to affected cell subsets along the way.
But scRNA-seq has a structural blind spot: it requires dissociating tissue into a single-cell suspension first. Cells don’t exist in isolation in a suspension — they exist in a densely organized, three-dimensional structure, and dissociation strips away exactly the cell-cell interactions that occur in that native space, in a highly compartmentalized organ where those interactions matter.
Moving Single-Cell Spatial Analysis Into 3D
To close that gap, Stellaromics developed and validated a 64-gene panel purpose-built for subsetting key cell populations directly within intact, thick adult mouse kidney tissue sections — preserving native tissue architecture rather than approximate it from thin slices.
Adult C57BL/6 mouse kidney tissue was cryosectioned at 50 μm and processed using the STARmap™ sample preparation protocol: sections were hybridized with gene-specific SNAIL™ probes, ligated and amplified in situ, and embedded in a hydrogel to lock in spatial architecture before imaging. Sequencing rounds were captured on Pyxa®, a confocal system with z-stack acquisition built to resolve three-dimensional transcript distributions rather than a single imaging plane.
From Raw Transcripts to a Validated Cell Map
After imaging, cells were segmented using DAPI nuclear staining combined with transcript density, then filtered for quality — retaining only cells with 5 to 350 transcripts and a total volume between 200 and 10,000 μm³. Transcript counts were normalized by cell volume, log-transformed, and clustered using the Leiden algorithm in Scanpy, with cell types manually annotated from canonical marker genes.
The result: the 64-gene panel successfully subset the kidney’s major cell populations, and spatial mapping confirmed that each cell type localized to its expected anatomical region within the kidney’s overall architecture. That’s a meaningful validation in its own right — it demonstrates that STARmap-based 3D sample preparation and sequencing, first proven in neural tissue, is directly compatible with the kidney’s distinct structure and composition.
Why This Matters for Nephrology Research
A validated, spatially resolved cell-typing panel is the necessary first step toward a larger goal: localizing the disease-associated cell populations that scRNA-seq atlases can identify but can’t spatially place on their own. Three-dimensional insight into how kidney cell populations are organized and interact in situ is crucial groundwork for identifying new therapeutic targets and developing more precise diagnostic and prognostic biomarkers for kidney disease — building directly on the cellular atlases scRNA-seq has already produced for conditions like diabetic nephropathy, acute kidney injury, and renal cell carcinoma.
Beyond the Brain: 3D Spatial Biology Across Organ Systems
This kidney panel is also evidence of something broader about 3D spatial transcriptomics: it is not a neuroscience-specific method. The same Pyxa platform and STARmap chemistry used to map neural circuits in brain tissue extends to structurally distinct organs, imaging intact tissue sections up to 100 μm thick across tissue types. For nephrology researchers who have relied on dissociation-based atlases to characterize kidney disease, that means the next layer of insight — exactly where disease-relevant cells sit relative to one another in the intact organ — no longer requires giving up single-cell resolution to get it.
Frequently Asked Questions
What is 3D spatial transcriptomics, and how does it differ from single-cell RNA sequencing in kidney research?
Single-cell RNA sequencing profiles gene expression in dissociated individual cells, generating comprehensive cell-type atlases but losing information about how those cells are organized in tissue. 3D spatial transcriptomics profiles gene expression directly within intact tissue, at single-cell resolution, while preserving the spatial relationships between cells.
How many genes are in Stellaromics’ mouse kidney cell-typing panel?
Stellaromics validated a 64-gene panel for subsetting key kidney cell populations in 50 μm thick adult mouse kidney tissue using STARmap sample preparation on the Pyxa platform.
Can 3D spatial biology help identify kidney disease biomarkers?
Three-dimensional spatial mapping of kidney cell populations is intended to support the identification of disease-associated cell neighborhoods relevant to conditions such as diabetic nephropathy, acute kidney injury, and renal cell carcinoma, building on existing single-cell atlases of kidney disease.
Source: Spatial Organization of the Mouse Kidney in 3D (Application Brief)