
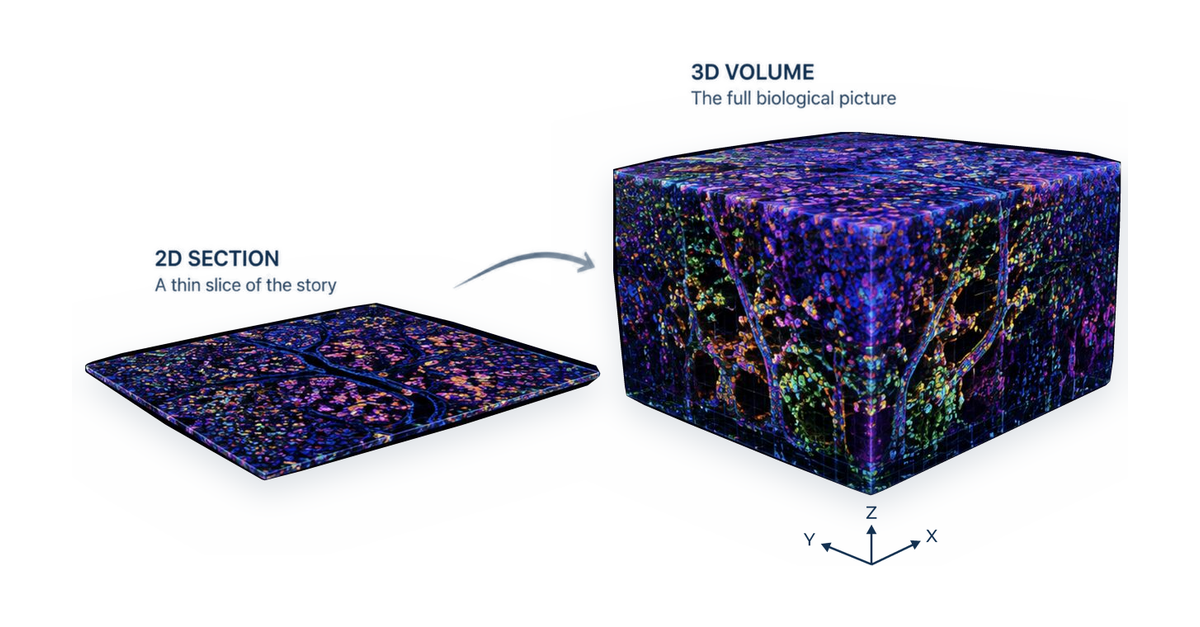
Decades of standard histology have systematically underestimated cell density, proximity, and tissue complexity — the data show exactly how much.
For decades, spatial biology and histology have relied on a simple convention: cut tissue into thin (5–10 μm) sections, mount it on a slide, and image what’s there. It’s fast, standardized, and built into nearly every commercial spatial transcriptomics platform on the market. It’s also, according to a growing body of tissue-level data, quietly undercounting the biology researchers are trying to measure.
What Gets Lost When Tissue Is Sliced Thin
A single 5–10 μm section captures only a narrow cross-section of a three-dimensional structure, which introduces four specific, well-documented problems: sampling bias, where thin slices miss rare cells or features entirely; structural misrepresentation, where large or complex structures like neurons and vasculature get truncated; distorted cell relationships, where 2D projections understate the true distance and adjacency between cells; and disrupted cell morphology, where the physical act of serial sectioning shears cell layers apart.
None of these are hypothetical. They show up directly when the same tissue is sampled at different thicknesses and compared side by side.
The Data: How Much Does Thickness Actually Change the Picture?
In an analysis of healthy mouse brain tissue, cell density measured in a standard 5 μm section averaged 4.25 cells per 100 μm². The same tissue imaged at 100 μm thick — an intact volume rather than a single thin slice — measured 65.75 cells per 100 μm². That’s a more than 15-fold difference in apparent cell density, depending entirely on tissue thickness.
The effect isn’t limited to density counts. In a separate comparison using an Alzheimer’s disease mouse model, the number of detected cell-to-cell connections per reference cell rose from 6 in a 10 μm section to 13 in a 50 μm section of the same brain sample, while the average minimum distance between neighboring cells decreased correspondingly. Thin sections don’t just miss cells — they systematically understate how connected and how close together those cells really are.
Why This Matters Beyond the Numbers
Cell density and proximity aren’t cosmetic metrics; they’re the biology itself. Disease progression, immune infiltration, and therapeutic response all depend on how cells are actually arranged and how close they sit to each other and to structures like tumors, plaques, or blood vessels. A method that systematically undercounts adjacency misses key biological interactions driving tissue and disease behavior.
As Stellaromics CEO Todd Dickinson put it at the launch of Pyxa, “Every [other] spatial transcriptomics platform on the market today forces researchers to infer 3D biology from flat sections.” Inference, in this case, comes with a measurable cost — a 15-fold undercount in density and roughly half the true cell-cell connectivity in the examples above.
Moving From Inference to Measurement
Pyxa was built specifically to negate that inference. The platform performs spatial transcriptomics directly within intact tissue sections up to 100 μm thick — roughly 10 to 20 times thicker than conventional 2D platforms — using STARmap™ in situ sequencing chemistry to detect RNA at subcellular resolution throughout the full tissue volume, rather than reconstructing an approximation from stacked 2D slices.
That distinction matters most in tissue types where thin sections struggle: brain tissue with long-range neuronal connections, disease microenvironments with sparse or rare cell populations, and any tissue where a cell’s true 3D shape — not just its 2D cross-section — determines its function.
Frequently Asked Questions
What is the difference between 2D and 3D spatial transcriptomics?
2D spatial transcriptomics analyzes thin (typically 5–10 μm) tissue sections, capturing only a cross-section of the tissue. 3D spatial transcriptomics analyzes intact tissue volumes up to 100 μm thick, preserving native architecture and the true spatial relationships between cells.
Why do thin tissue sections underestimate cell density?
A thin section captures only a narrow slice of tissue depth, so cells extending above or below that plane are undercounted. Measurements on mouse brain tissue found roughly 15 times more cells per 100 μm² in a 100 μm-thick section than in a 5 μm section.
Can 2D tissue sections accurately measure cell-cell interactions?
Not reliably. Comparisons of brain tissue at different thicknesses show significantly fewer detected cell-cell connections in thin sections than in thick sections, indicating that 2D methods understate true cell-cell connectivity.