
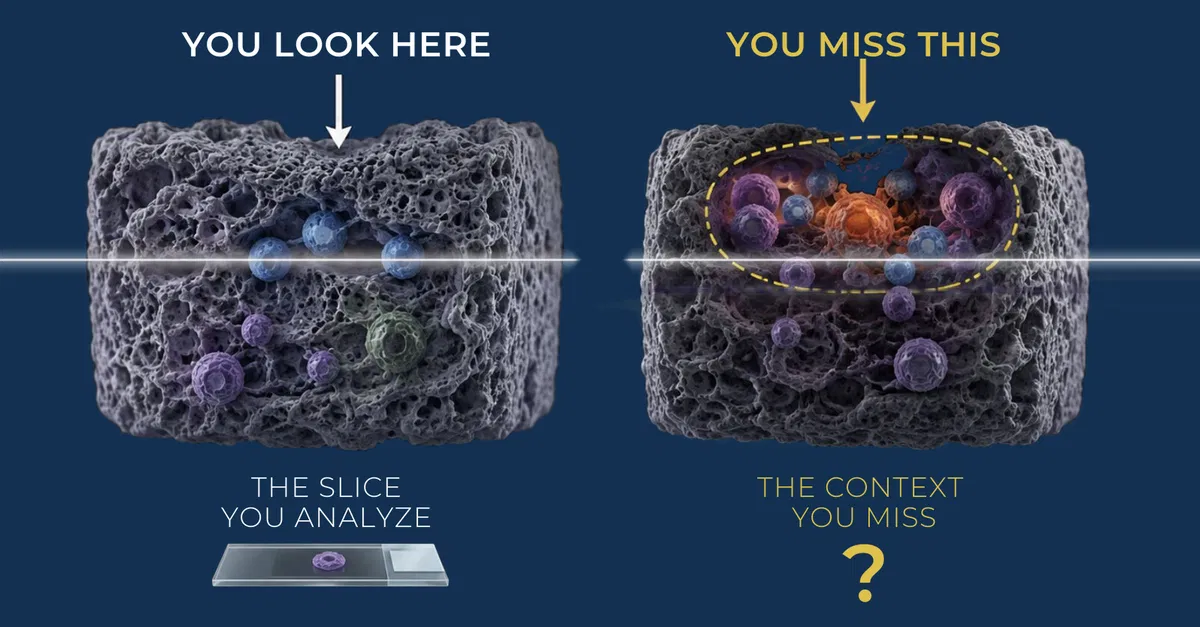
Conventional spatial biology methods rely on thin, 5–10 μm tissue sections. But even following computational reconstruction these thin tissue slices strip away the true three-dimensional context of cell-cell interactions. 3D spatial multi-omics takes a different approach: rather than reconstructing thin tissue images into a “2.5D” approximation of the whole, it captures gene expression, RNA translation, and tissue morphology directly in thick, intact tissue — revealing cellular neighborhoods, rare cell populations, and structural relationships that conventional approaches simply can’t resolve.
Defining 3D Spatial Multi-Omics
3D spatial multi-omics is the study of gene expression, mRNA translation, and molecular interactions throughout the three-dimensional architecture of intact tissue. Cellular diversity is resolved at sub-cellular levels, while spatial relationships within cellular neighborhoods remain intact, preserving the tissue microenvironment as it exists in vivo. Combining transcriptomics, translatomics, proteomics, and morphological analysis builds a more complete view of a biological system than any single-cell or 2D spatial technique can provide.
Why 2D Methods Miss Critical Biology
Traditional spatial platforms rely on 5–10 μm sections, but cells typically span 10–25 μm in diameter, so sectioning at this scale slices through individual cells, distorting cell morphology and spatial relationships. That introduces four recurring problems:
- Sampling bias: rare cell populations, gene-edited cells, immune infiltrates, and features in deeper tissue layers go undetected
- Structural misrepresentation: large or complex structures such as vasculature, neural networks glomeruli, and plaques are obscured in a single plane
- Distorted cell-cell relationships: 2D projections misrepresent the true distance and adjacency between cells
- Disrupted morphology: sectioning shears through cells, making true segmentation impossible
These concessions shape the accuracy and relevance of everything downstream, from cell typing to inferring mechanisms of diseases and therapeutics.
Spatial Translatomics and Proteomics Add Additional Layers
mRNA and protein levels don’t always directly correlate. RIBOmap™, developed alongside STARmap, maps the translatome — actively-translating mRNAs associated with the ribosome — at single-cell resolution in intact tissue, revealing translational dysregulation that gene expression data alone can’t detect. Together, STARmap plus RIBOmap lets researchers capture data on both gene expression and translation at specific tissue locations, something dissociation-based methods like single-cell RNAseq fundamentally cannot capture. This data can be further extended with the addition of multiplexed antibody-based protein detection, measuring protein localization and abundance directly within the 3D tissue microenvironment.
How it Works: A Complete Workflow, From Tissue to Visualization
3D gene expression mapping starts with intact, thick tissue sections of up to 100 μm. STARmap™, the in situ sequencing chemistry behind Stellaromics’ approach, uses paired primer and padlock probes (SNAIL™ probes) to bind the target RNA. Rolling-circle amplification builds a bright, localized amplicon at the RNA’s true position in 3D space. The tissue is then embedded into a hydrogel and cleared to permit imaging through the 100 μm volume.
On-instrument, the Pyxa® platform automates volumetric confocal imaging. SEDAL (Sequencing with Error-reduction by Dynamic Annealing and Ligation) uses reading probes to decode bases and fluorescence probes to transduce decoded sequence information into fluorescence signals that are detected across multiple imaging rounds. The instrument performs primary data analysis, assigning transcripts to segmented cells throughout the volume and removing the alignment artifacts and bioinformatics burden of stitching thin 2D sections into a “2.5D” reconstruction.
Data output is compatible with standard spatial omics analysis tools like Seurat, Squidpy, and other R- or python-based packages. Data visualization is made possible with PyxaStudio™, Stellaromics’ own platform built for 3D spatial data visualization and included on the Pyxa instrument.
Frequently Asked Questions About 3D Spatial Multi-Omics
How does 3D spatial multi-omics differ from 2D methods?
3D methods analyze tissue up to 100 μm thick, preserving multiple cell layers and spatial relationships within the native tissue architecture. 2D methods use 5–10 μm sections that destroy cell and tissue morphology and miss rare cell populations.
What tissue thickness does the Stellaromics Pyxa platform support?
Pyxa images tissue sections from up to 100 μm thick — up to 20 times thicker than the sections used by 2D spatial transcriptomics platforms.
What is the total imaging area on Pyxa?
The imaging area is 54 mm² per well. Pyxa handles samples in a 12-well plate format, and is currently capable of imaging 4 wells per run.